Short Drama App Store Ratings: Two Scores, 4.49–4.90 and 3.08–4.45
Every short-drama app has two different scores: Apple's own store rating, from 2,136,990 raters (4.49–4.90), and our average of the 2,839 written reviews Apple's feed returns (3.08–4.45). They rank the six apps differently — here are both, side by side, with the gap explained.
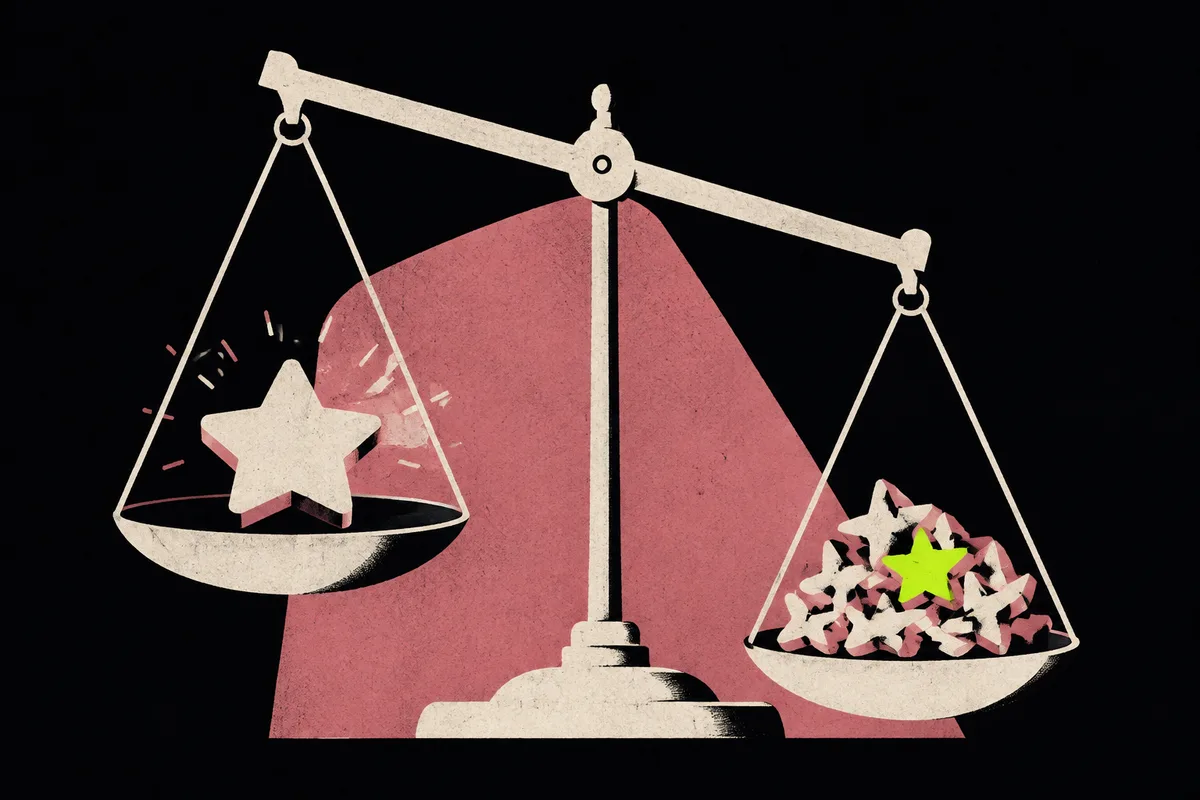
The short answer
Every short-drama app in this category carries a high App Store rating. The six we track all sit between 4.49 and 4.90. That number is real — and it is not the score given by the people who actually wrote something.
Apple exposes two different figures, computed over two different populations:
- The App Store rating (we’ll call it the store rating from here) — the star average printed on the listing, taken from everyone who tapped stars. Across our six apps that is 2,136,990 raters.
- The written-review average — our own arithmetic over the reviews that contain text, which is all Apple’s public review feed returns. Across the same six apps that is 2,839 reviews, pulled from the US store on 25 August 2026.
That sample works out to about one written review for every 750 raters. Those two crowds do not agree. The distance between the store rating and the written-review average runs from +0.27 points (NetShort) to +1.55 points (DramaBox) — nearly a six-fold spread — and sorting the six apps by one figure gives you a different order from sorting them by the other.
We know how easy this is to get wrong because we got it wrong. An earlier version of this analysis, written in August 2026, labelled the written-review averages as Apple’s own averages. That put DramaBox at the bottom of the list, when its store rating is the second highest of the six. It has been corrected. This page exists so the distinction is written down somewhere permanent, with both numbers on the same screen.
One boundary before the tables: everything below rates apps, not shows. No platform publishes a score for an individual drama, we have never seen one, and we do not print one.
The two numbers, side by side
Store rating and rater count come from Apple’s own app-lookup data. The written-review average is ours: the mean of the star scores attached to the text reviews Apple’s public review feed returned for that app, on the US store, on 25 August 2026.
| App | Store rating | Raters | Written-review average | Written reviews (n) | Gap | Position: store rating → written-review average |
|---|---|---|---|---|---|---|
| GoodShort | 4.90 | 513,303 | 4.23 | 464 | +0.67 | 1st → 2nd |
| DramaBox | 4.76 | 830,922 | 3.21 | 485 | +1.55 | 2nd → 5th |
| NetShort | 4.72 | 137,795 | 4.45 | 466 | +0.27 | 3rd → 1st |
| ReelShort | 4.69 | 476,870 | 3.43 | 479 | +1.26 | 4th → 4th |
| ShortMax | 4.61 | 170,737 | 3.08 | 483 | +1.53 | 5th → 6th |
| FlexTV | 4.49 | 7,363 | 4.17 | 462 | +0.32 | 6th → 3rd |
| Total | — | 2,136,990 | — | 2,839 | — | — |
Read the last column first. DramaBox is second by store rating and fifth by written-review average. FlexTV is last by store rating and third by written-review average. NetShort is third by store rating and first by written-review average. Only ReelShort holds its position.
That is why these two figures can never be swapped for one another, and why a sentence like “DramaBox is rated 3.21” is simply false: DramaBox’s store rating is 4.76 across 830,922 raters. Its written-review average is 3.21 across the 485 reviews in our sample. Both are true. They are answers to different questions.
Why the gap exists at all
Apple’s public review feed returns only reviews that have text. Tapping four stars and closing the dialog puts you in the store rating and nowhere else; typing three paragraphs about a paywall puts you in both.
Writing takes effort, and effort is unevenly distributed. The evidence is that the gap points the same way for all six apps — every single one has a written-review average below its store rating, with no exceptions and no app where the writers were kinder. A one-sided result across six independent apps is a property of the sampling, not a property of any one app.
So the written-review average is not a worse version of the store rating, and it is not a better one. It measures a self-selected minority — our sample holds about one written review per 750 raters — that skews negative for structural reasons. Neither figure is the “true” score. The store rating is what over two million people tapped; the written-review average is what a few hundred people typed.
The store rating cannot rank these six apps
Short drama App Store ratings all live in the same narrow strip. The six store ratings fall inside a 0.41-point band, from FlexTV’s 4.49 to GoodShort’s 4.90. Ordering apps inside a band that narrow is ordering noise, and the rater counts make it worse: FlexTV’s 4.49 rests on 7,363 raters while DramaBox’s 4.76 rests on 830,922 — a 113-fold difference in how much evidence sits behind two numbers printed in the same typeface.
This is the practical takeaway for anyone comparing short-drama apps in the store. The store rating tells you none of the things that separate these apps from each other. It does not tell you what an episode costs, how far into a series the paywall sits, or whether the app cancels cleanly. If you are choosing between them, our platform comparison and the cost breakdowns are built on figures that do differ between apps.
The gap is the part worth reading
If the store rating cannot separate these apps and the written-review average is a skewed minority, what survives? The distance between them.
NetShort’s two figures are 0.27 points apart. DramaBox’s are 1.55 apart. Both apps have a store rating in the 4.7s, so the store rating alone makes them look like near-identical products. They are not behaving identically at all: on NetShort, the people who write and the people who only tap stars are describing roughly the same experience, and on DramaBox they are describing two quite different ones.
We can measure that divergence. We cannot tell you which population is right — that would require knowing something about the 830,000-odd DramaBox raters our review sample does not reach, and there is nothing of theirs to read. What the gap does is tell you where reading the reviews is worth your time. On DramaBox, ShortMax and ReelShort, the written text carries information the store rating does not. On NetShort and FlexTV it mostly confirms it.
Two text features, and what they are not
The same script measured two properties of the review text itself.
| App | Duplicate text | Template phrasing |
|---|---|---|
| NetShort | 3.2% (11 of 339 eligible) | 7.3% (34 of 466) |
| GoodShort | 0.9% (3 of 336) | 3.9% (18 of 464) |
| DramaBox | 0.2% (1 of 434) | 2.1% (10 of 485) |
| ShortMax | 0% (0 of 383) | 1.0% (5 of 483) |
| FlexTV | 0% (0 of 327) | 0.9% (4 of 462) |
| ReelShort | 0% (0 of 351) | 0.2% (1 of 479) |
These are text features and nothing more. Duplicated wording has innocent explanations — a user reposting after an update, a phrase that a whole category of reviewers reaches for. We do not infer motive from them and neither should anyone quoting this table. NetShort’s 3.2% is 11 reviews, which is exactly why the absolute count belongs next to the percentage: a rate computed on a few hundred items moves a full percentage point every three or four items.
The duplicate column only compares reviews that survive normalisation at 30 characters or more, which is why its denominators are smaller than the review counts — short reviews collide by accident and would poison the measure.
That rule exists because our first version of this check was wrong. The original fingerprint stripped everything except a-z0-9, which flattened Arabic and Korean reviews into empty strings so that they all matched each other. It reported FlexTV at 8.7% duplicates. The true figure is 0%. The fix was to keep any letter or digit in any script and to exclude anything under 30 normalised characters. We mention it because a number that looked completely plausible was completely wrong, and the only reason we know is that the check is a script that can be re-run.
Written reviews are a bad score and a good source
Everything above argues against using the written reviews as a number. It is not an argument against reading them, because on one subject they are the only public source there is.
Apple’s listing does not carry what a single episode costs in coins, and for five of these six apps no source outside the reviews carries it either — FlexTV’s 65 coins an episode, reported to us on a pricing sheet, is the one exception. Reviewers give the number in passing, and a script can pull those mentions out. DramaBox reviewers reported 5 coins an episode (9 reports, range 5–50) against a coin price with a median of $0.0998 (4 reports, range $0.01–$0.10); multiplying the two medians is our arithmetic, and it gives roughly $0.50 an episode. ShortMax reviewers reported 80 coins an episode (4 reports, range 60–84) against a coin price of $0.010 (3 reports, one as low as $0.0067), which puts an episode between $0.53 and $0.80. These are their claims, not our measurements. Sample sizes that small are order-of-magnitude readings rather than price lists, and the claims span app versions going back to 2024 — prices change, and you should confirm any figure inside the app before paying.
That is the correct division of labour. The written reviews are worth mining as text and worth nothing as a score. Our guide to how these coin systems work and the free-app comparison both run on figures extracted this way, always with their sample sizes attached.
How to read a short-drama app’s store listing
- Read the rater count before the store rating. 4.49 from 7,363 raters and 4.76 from 830,922 are not comparable quantities.
- Do not rank by the store rating. The whole category fits in 0.41 points.
- Read the written reviews as text, never as an average — and if you do average them, label the result as what it is. It is not the App Store rating.
- Sort the reviews more than one way. Apple’s feed returns different content under “most helpful” than under “most recent”; we collect both, and the two orders surfaced different cost figures entirely.
- Take the specifics, leave the verdicts. A reviewer saying an episode cost them 80 coins is reporting something checkable. A reviewer saying an app is great is reporting a mood.
What this does not cover
- US store only, one snapshot. Everything here was collected on 25 August 2026 from Apple’s US storefront. Store ratings move.
- Apple’s feed is not a census. It returns at most 10 pages of 50 reviews per sort order, and Apple does not state how it samples. Between 462 and 485 reviews per app is the best public sample available, not all of them.
- The written-review average is our arithmetic. Apple does not publish it. Only the store rating is Apple’s own figure.
- Android is absent. These are Apple numbers. Google Play may look completely different.
- Duplicate and template rates describe text, not intent. Repeat that wherever these figures travel.
- App scores, not show scores. No score for any individual drama appears here, because none exists in any source we trust.